The following plot is from page 622 from a paper by Philip, et al., 2019.
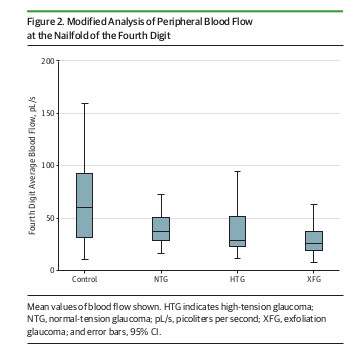
I’m pretty sure that this plot is of standard box plots, which show the median (line inside of the box), the first and third quartiles (the lower and upper edges of the box) and some measure of outliers (the “whiskers”). This plot is clearly not of means and 95% CIs since each box plot lacks symmetry (i.e., sample mean +\- t*standard error of the mean).
I think including a plot like this is a great idea; showing the reader the data in some form is good practice. But I’m amazed that the authors and reviewers missed this error, and I wonder if there are other errors in the statistical analysis.